
16
Oct2013
New in XLCubed 7.5
by anon
in News
XLCubed version 7.5 is now available! It delivers key additions in the web and mobile environments alongside a number of incremental changes and improvements.
Main Additions
- New web ad-hoc analytic and reporting capability for web based users
- Slice and dice analytics in Mobile apps and devices
- Interactive Charting
- Publication and sharing of PowerPivot reports
Web and Mobile Analytics
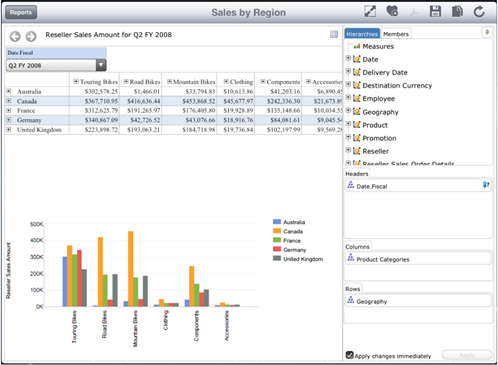
XLCubed 7.5 provides web and mobile users with cube browsing, reporting and analytics. Multi-view ‘analytic books’ can be created from scratch, incorporating dynamic data grids, standard charting, treemaps and small multiples. You can quickly explore their data through drilling and slice and dice, and easily add their own calculations, rankings and report slicers. All the analytic functionality can be accessed through our mobile apps for iOS and Android, giving a rich cube browsing and data exploration experience on mobile devices.
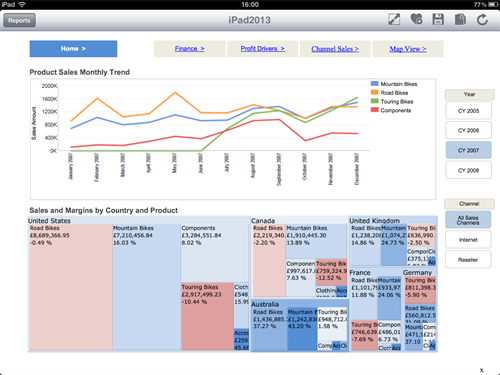
Interactive Charting
XLCubed reports can now incorporate interactive, clickable charts. You can click or touch a data point of interest to update the rest of the report in-context, and easily explore the data using the chart as a driver, or drill to additional levels of detail in the chart.
Publication and sharing of PowerPivot
PowerPivot models are seamlessly up scaled into server based Analysis Services by simply publishing the PowerPivot report to XLCubed Web Edition. Web based users can then access the XLCubed developed dashboards or analytical workbooks without the need for SharePoint, or high specification local machines.
A full list of changes in XLCubed 7.5 is available on the XLCubed website.
Would like to download a trial of XLCubed?
Categories
Recent Posts
Archives
- 2019
- 2015
- 2014
- 2013
- December
- November
- October
- Downsizing Dangers - 28th October 2013
- Dynamics NAV NAS/Job Queue - Excel SaveAs method failed - 18th October 2013
- New in XLCubed 7.5 - 16th October 2013
- How to suspend and resume SQL database mirroring - 15th October 2013
- XLCubed: Excel Dashboards - 11th October 2013
- Analytical Applications of Business Intelligence Reporting - 10th October 2013
- What is Microcharts? How can it clarify data? - 10th October 2013
- Can’t print from XLCubed Web Edition - 2nd October 2013
- September
- June
- February
- January
- 2012
- 2011
- November
- August
- July
- May
- A call to SSPI failed in NAV 2009 R2 - 31st May 2011
- Can’t send BizTalk documents from NAV2009 Role Tailored Client - 23rd May 2011
- Unique External Document No. on Sales Order - 23rd May 2011
- CRM 2011 – NAV 2009 R2 Synchronisation – tips and tricks - 10th May 2011
- Manually Create NAV Service Instances - 3rd May 2011
- April
- March
- February
- January
- 2010
- December
- November
- SQL Maintenance plan won't run, modify or delete - 24th November 2010
- Miscellaneous NAV RTC Development Tips - 21st November 2010
- NAV RTC Development training tools - 18th November 2010
- Microsoft Dynamics NAV Application Objects - 15th November 2010
- Delete a rogue Conur Expense Report - 12th November 2010
- CRM - 9th November 2010
- October
- September
- February
Tags
- 2009
- 64bit
- antivirus
- application objects
- BI
- BizTalk
- blocking
- Business
- Business Intelligence
- c#
- C#
- cached password
- calculation
- CGRS
- Cloud
- Commerce Gateway
- concur
- CRM 2011
- CRM 2013
- Crystal Reports
- csv
- Data Type
- date and time
- deadlock
- delete
- DotNet
- Downsizing
- Dynamics
- Dynamics NAV
- EDI
- ERP
- Excel Buffer
- External Document No.
- Generate xsd from SQL table
- impersonation
- Jigsaw
- Job Queue
- MDX
- Microsoft Excel
- NAS
- NAV
- NAV 2009
- NAV 2009 R2
- NAV Application Server
- NAV Development
- NAV Upgrade
- NAV2009
- NAV2013R2
- NAV2015
- Navision
- new version
- no delimiter
- NST
- OLAP
- Permissions
- printing
- regsvr32
- right-click
- security
- Security
- service broker
- SMTP
- SQL
- SSPI
- SSRS
- sync
- synchronisation
- umbraco
- upgrade
- User Setup
- Web Service
- xlcubed
- xmlport
- xp_ndo
- xp_ndo_enumusergroups
- xp_ndo_enumuserids