11
Oct2013
XLCubed: Excel Dashboards
Excel is recognised as the most widely used reporting tool in the world today. While many organisations have non-Excel core reporting applications, the final presentation layer is often Excel.
“A dashboard is a visual display of the most important information needed to achieve one or more objectives; consolidated and arranged on a single screen so the information can be monitored at a glance.” – Stephen Few, Information Dashboard Design (2006)
While there are multiple definitions of what a dashboard is, or should be, one universal theme is the concept of a single screen. When all the information is available on one screen without scrolling. In this way it's possible to see pattern and shared trend between the various aspects of the business which is not possible with traditional multi-screen layouts.
To fully leverage this effect, it's vital to have granular control over the sizing and positioning of the tables and charts comprising a dashboard. Charts can be sized and positioned freely, and rows and columns can be altered in size as required. There are even techniques to allow the simulation of variable width columns and rows.
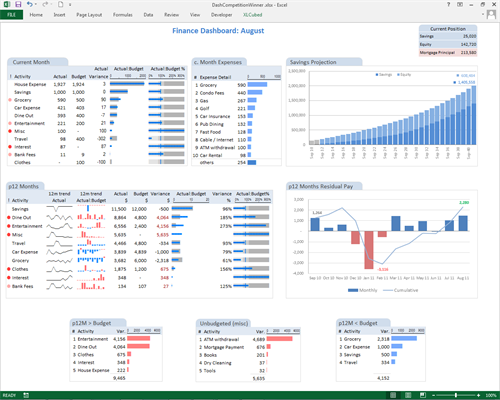
Even within the Excel environment, it can be a challenge to bring all the information onto one screen, and to retain enough visualisation within the report to make it easily digestible. Here the ability to easily create multiple small charts with MicroCharts has huge advantages. This enables creation of 'Visual tables', where the headline number is shown along with graphical elements for trend, comparison to target or exceptions. The Visual table approach, is highly space efficient, and brings together huge volumes of information in a manner which can be easily assimilated.
The example below was one of the winners in our 2008 Excel Dashboard Competition. It was developed by Jim Uden of Meridian Surgical Partners, on Hospital Outpatient data. Click on the image for background on the dashboard components and thought process behind the development.
Addressing Excel's Weaknesses
Despite the inherent strengths, there are two primary drawbacks associated with Excel for reporting and dashboarding, and the XLCubed suite of products can address both.
1) Spreadmarts
This is where data is either simply held in Excel, or copied from the central systems into Excel. Here Excel becomes a database rather than a presentation layer or calculation tool. Core data can be easily overtyped or become out of synch with the central repository. The ensuing problems are why Excel is so unpopular in many IT departments.
We're huge Excel fans, but don't believe it makes for a good database. XLCubed Excel edition extends the strengths of Excel, adding advanced analytics, and mitigating the weaknesses by connecting directly to server based data.
2) Report deployment
Excel is quick and nimble for report development, but is not well suited for large scale distribution. It doesn't handle multiple users especially well, and the alternative is distributing a potentially large workbook to hundreds of users each reporting cycle.
For large deployments the Web browser is the ideal. No client installation is required and users access a centrally updated version of the report. With XLCubed Web edition, data-connected reports can be built in Excel, and simply published to the web. The web version of the reports retain an active connection to the data, and also the dynamic nature of the in-Excel reports where required.
Example Dashboard